Written by the Tempdrop Team
Implantation dips are, in some communities, seen as a surefire way to identify pregnancy on a fertility chart. But are you aware of the science behind it? And is it really true?
First of all, it's important to understand what causes your temperature to rise after ovulation: hormones.
Estrogen
Estrogen is the dominant hormone during the follicular phase (the first portion of the cycle, leading up to ovulation). Estrogen does plenty of things: helps with blood clotting, assists in bone development, and even plays a big part in mood and brain health.
In addition, estrogen inhibits heat-retaining functions in the body. In short, when heat retention is lower, your body will also have a lower temperature. This is part of why, in a basal body temperature (BBT) chart, there is a noticeable shift up after ovulation.

Progesterone
Progesterone is a wonderful hormone, as well. It's dominant in the luteal phase (after ovulation and before your next cycle starts again). It's a natural anti-anxiety agent, regulates sleep, and even acts as a natural anti-inflammatory.
Opposite of estrogen, progesterone has a thermogenic effect. Thermogenic means it tends to produce heat. In this case, the affect of progesterone increases the heat in the body, resulting in a visible shift up on a BBT chart. This is the other half of what makes a noticeable temperature shift at ovulation.
So now that we understand the hormones involved and what causes temperature changes, let's talk about implantation dips - or at least the assumptions about them:
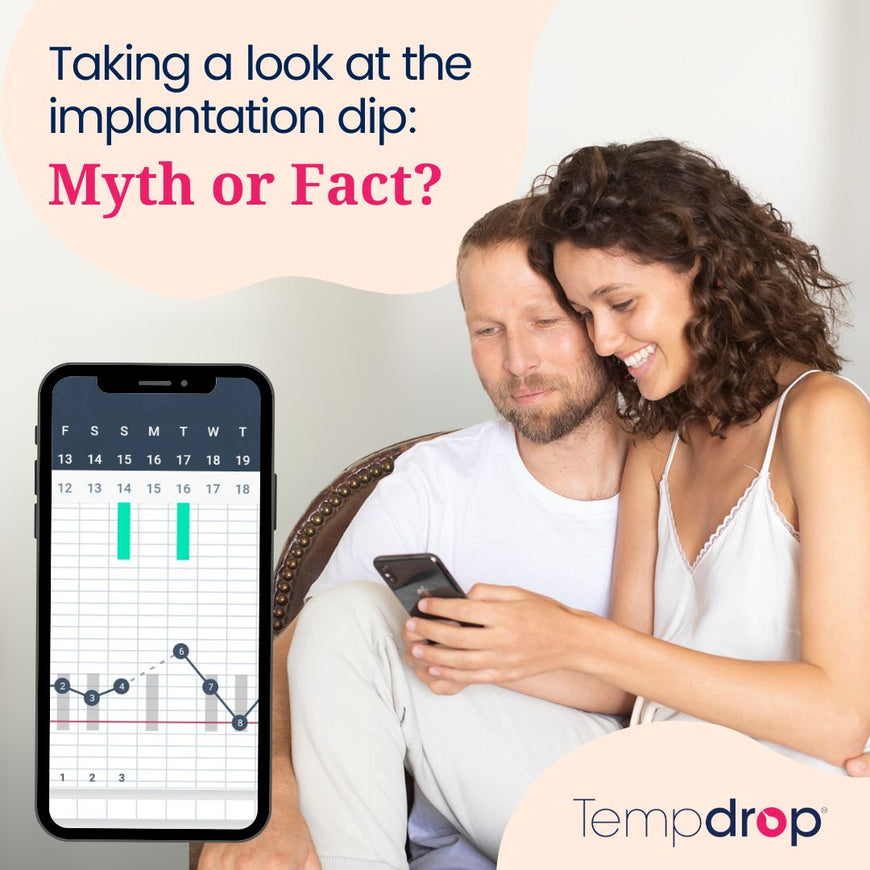
An implantation dip is generally accepted as when BBT decreases during the luteal phase, typically 5-8 days into the temperature shift. It drops a noticeable amount, but only for a single day.

Some groups write off implantation dips because there are plenty of factors affecting your BBT, including, but not limited to,
- illness,
- stress,
- schedule,
- travel, and
- medication.
The claim is something external must be affecting temperature to drop it. However, dips can be seen in a wide range of charts, with relative consistency in the amount they dip (below or close to pre-ovulatory ranges) and when they dip (5-7 days after the shift started typically).
The Evidence
It's not abnormal to see a temperature dip on any ovulatory chart, about 5-7 days after your temperature shift begins. This isn't just in pregnancy charts. So what is it?
Current knowledge and evidence of the menstrual cycle suggests that, 5-7 days following ovulation, estrogen often sees a small rise again. As you remember from above, estrogen causes temperature to be suppressed, or lower. So the reason your temperature may dip - even if you're not pregnant - during your luteal phase is a slight estrogen surge! This is also probably also the reason the temperature dips to be near the coverline rather than far below it: progesterone is still active, so only one hormone is causing the drop.
Now, when you're pregnant, estrogen levels have been found to be slightly higher mid-way through the luteal phase than when you aren't, so it is observable that more pregnancy charts have a luteal phase dip than non-pregnancy charts. But because these dips are present in both pregnancy and non-pregnancy charts, we have to say that they are estrogen dips or luteal phase dips rather than implantation dips.
Have you seen temperature dips during your luteal phase? If so, let us know over on Instagram about your experience with them!

