

Replacement Tempdrop 2.0 Unlocking Pin
$4.99

Armband Size Guide
Upper arm circumference
How to Measure

Size chart
| Size | Inches | cm |
|---|---|---|
| Standard Armband | 8.5″ – 15.5″ | 21.5 – 39 cm |
| Extra-Long Armband | 12.5″ – 18.5″ | 31.5 – 47 cm |
Confused by your temperatures? See real pregnant vs. not pregnant basal body temperature charts side-by-side in this article.


Updated November 17, 2026

Not sure if you're pregnant or not? If you're not pregnant, your temperature usually drops as your period approaches, because progesterone falls. If your temperatures stay high for 18 days after ovulation, that's considered consistent with pregnancy. In this article we provide example charts of both (pregnant and non-pregnant charts), plus what a triphasic pattern and an implantation dip can and can't tell you.
If you track your basal body temperature (BBT), it’s very common to find yourself analyzing your chart with a fine-tooth comb, wondering if every little temperature shift, rise, or dip could be an early indicator of pregnancy (or not). We understand that if you’re trying to get pregnant, that Two Week Wait (2WW), that stretch between your fertile window and when your period is due, can feel like an eternity.
While it is always best to take a pregnancy test (urine or blood) as it is the only way to know with certainty whether you are pregnant, your BBT chart can help offer clues. If you know what you’re looking for, using the basal body temperature method can provide early insight into a possible pregnancy.
Once you understand the biology driving changes in your body, you might even find yourself nerding out… in a good way.
If you are a first-time reader, your basal body temperature (BBT) is your body's lowest resting temperature. To take your basal body temperature accurately, you must use a highly sensitive basal thermometer and record your temperature at the same time every morning.
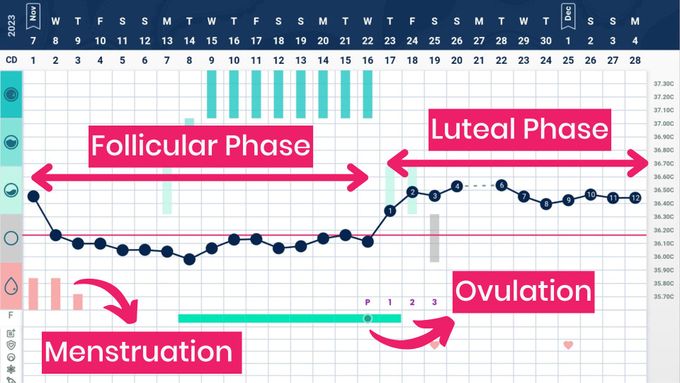
A healthy menstrual cycle follows a biphasic pattern driven by hormones:
When you measure your BBT and notice a sustained increase in temperature, it confirms ovulation. Now, how do we use this luteal phase data to detect early pregnancy?
Before we talk about pregnancy symptoms and early pregnancy signs, it’s important to understand what actually affects your BBT throughout your menstrual cycle.
A healthy menstrual cycle follows a biphasic pattern. This simply means you’ll see one steady pattern of lower resting temperature before ovulation, followed by a noticeable step-up afterwards. These shifts are driven by hormonal changes. When you take your basal body temperature, you are tracking the lowest resting temperature of your body.
In the first half of your cycle, estrogen is the dominant hormone. Think of estrogen as the cooling hormone—it keeps temperatures lower before ovulation. After ovulation, the follicle that released the egg becomes the corpus luteum, which produces progesterone for the luteal phase.
Progesterone turns the heat up. It causes the body to experience an increase in temperature. It’s responsible for the higher temperatures you see after ovulation and those high luteal phase temperatures.
So how do we use this information when you measure your BBT during the Two Week Wait?
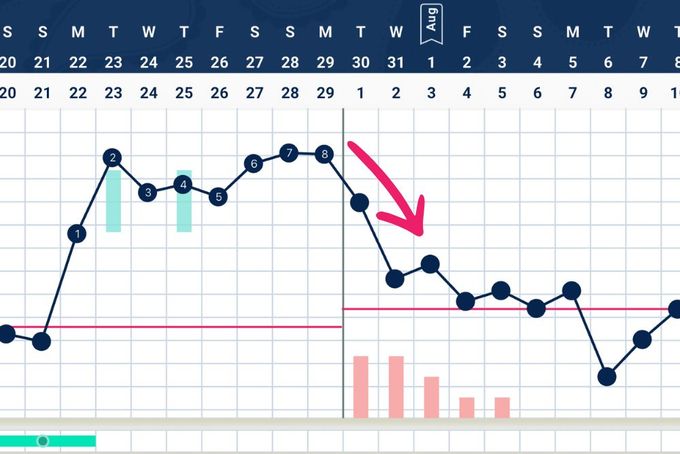
In a cycle where you’re not pregnant, your temperature remains elevated after ovulation and then you will notice a temperature drop as the period approaches. This is often called the pre-menstrual drop.
It’s important to know that this drop in temperature doesn’t always happen the day before bleeding starts. For some, temperatures fall a day or two earlier or may not drop until after the bleeding has already begun. The key to remember is that the temperature will drop during menstruation, signaling the start of a new cycle.
This happens because progesterone levels fall when the egg isn’t fertilized. Progesterone is what makes your BBT stay high after ovulation, so when it drops, your basal temperature drops too, and the uterine lining sheds.
No pregnancy → progesterone falls → temperature drops → period begins
There are a few key patterns people using natural family planning and BBT tracking look for when wondering whether a cycle was successful, particularly to detect pregnancy early and avoid false negative results. If you take your BBT every morning at the same time, you may be pregnant if you spot these trends.
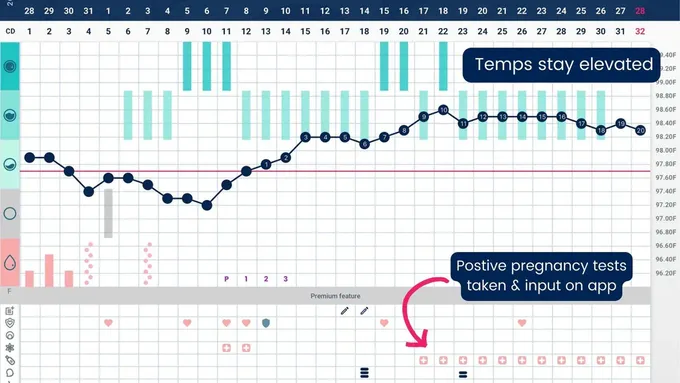
One of the most well-known guidelines in charting is the 18-Day Rule. If ovulation has been confirmed and your temperatures stay high throughout the luteal phase for 18 days post-ovulation, this is clinically considered consistent with pregnancy. When your BBT rises and stays high, you have a strong chance of being pregnant.
That said, many will agree, waiting that long before it's time to take a pregnancy test can feel like a very big ask.
Earlier, we talked about a biphasic pattern. A pattern that often gets attention in early pregnancy symptoms discussions is the triphasic pattern.
A triphasic chart shows a second temperature rise, creating a third level. This increase in BBT sometimes appears around 7–10 days post-ovulation. It’s often suggested that this happens due to sustained progesterone production later in the luteal phase, where the temperature rises slightly again.
Large datasets show that only around 12% of pregnant BBT charts display a triphasic pattern. So, if you don’t see your BBT do this, it doesn’t mean you aren’t pregnant.
Let’s talk about the notorious implantation dip. An implantation dip is described as a one-day drop that occurs around 7 days after ovulation.
After ovulation, progesterone ensures your BBT stays high. Some suggest that around the time implantation occurs, there may be a brief rise in estrogen. Because estrogen has a cooling effect, this temporary shift could cause a one-day dip.
Here’s the catch: mid-luteal estrogen rises also happen in non-pregnant cycles. There’s no evidence that this rise is triggered by implantation. An implantation dip has not been scientifically proven as a definitive early indicator of pregnancy. A single low temperature can happen in any cycle.
Overall, a long and sustained rise in temperature is a really good thing. Not only could it mean you're pregnant, but it also indicates that progesterone is being produced well.
Feature | Typical (Not Pregnant) Cycle | Pregnancy Chart |
|---|---|---|
Post-ovulation temps | Rise after ovulation | Rise after ovulation |
Luteal phase temps | Drop before, or during period | Stay elevated (18 high temperatures) |
Pre-menstrual drop | Common | Usually absent |
18 high temperatures after ovulation | No | Yes |
Triphasic pattern | Sometimes | Sometimes (not guaranteed) |
If you’re using a standard basal thermometer, temperature tracking can be surprisingly easy to throw off. Inconsistent wake times, broken sleep, or illness can all affect your readings. When you measure BBT and temperatures bounce around, it can make it harder to confirm ovulation.
This is where a wearable tracker like Tempdrop can make a real difference.
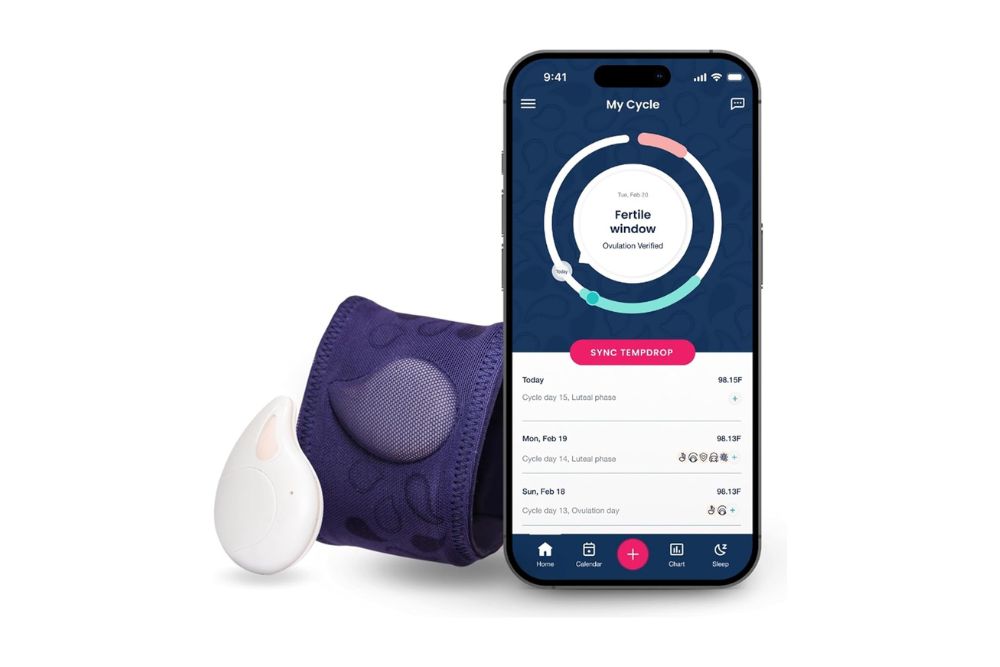
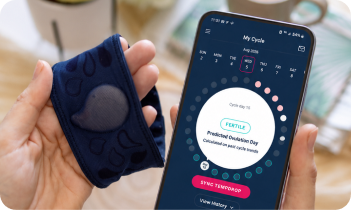
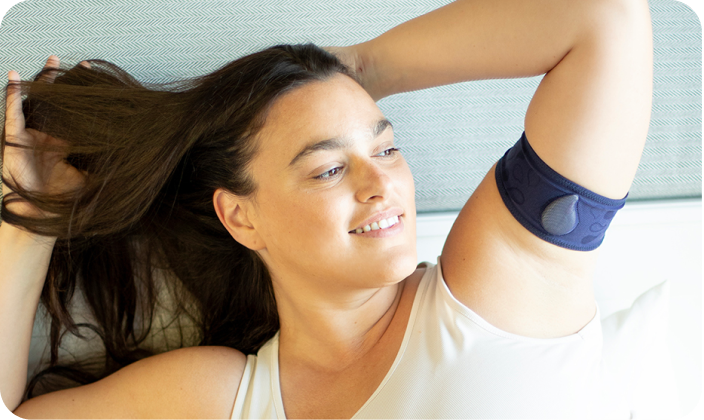
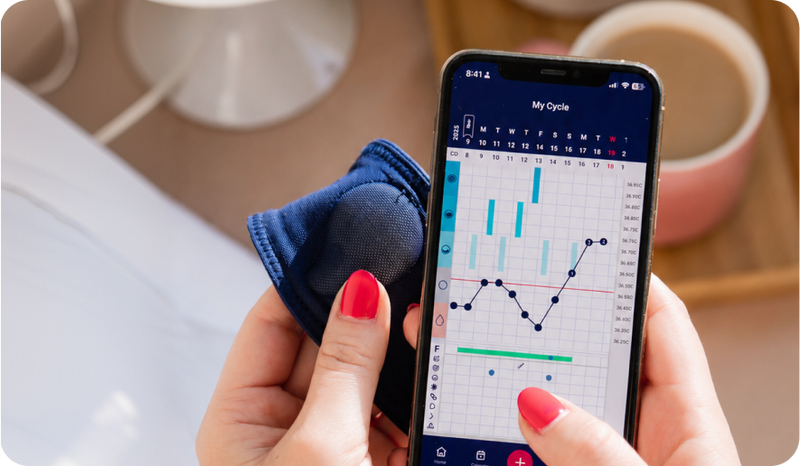
Tempdrop is a wearable device that collects data overnight. It helps take the noise out of tracking so you can record your temperature accurately and use a basal body temperature chart with confidence. If you start taking your basal body temperature with a reliable tracker, you are more likely to get pregnant by accurately pinpointing your fertile window.
Keep track of your BBT and don't guess with a messy chart. You can read more about the clinical evidence supporting Tempdrop here: Tempdrop Clinical Evidence.
We know that navigating the journey to get pregnant can be an emotional and overwhelming experience. Between learning how to use a basal body temperature chart, timing intercourse, and looking out for early pregnancy symptoms, it is a lot to handle on your own.
If you are trying to get pregnant and want expert guidance to remove the guesswork, check out Tempdrop's Conceive with Confidence program. This comprehensive bundle is designed to empower you with the exact knowledge, tools, and support you need to maximize your chances of getting pregnant naturally.

Averjill Rookwood
September 11, 2025

Ivy Joeva
August 26, 2025

Tempdrop Team
January 20, 2026

Tempdrop Team
January 20, 2026

Kingdom Sexuality
July 22, 2025